Peter Lynch Fair Value Calculator
Peter Lynch Fair Value Calculator and Peter Lynch Formula.
Peter Lynch Fair Value Calculator
- Try Premium for Free
- Instantly discover the Peter Lynch Fair Value for over 45,000 stocks – fully automated, zero effort.
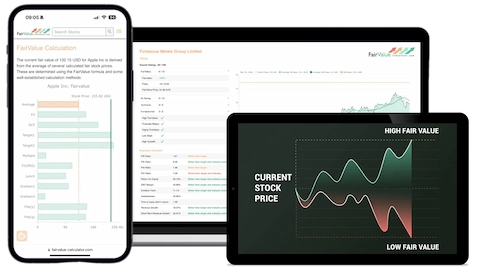
- The Pro Tool for serious investors: Automated stock analysis using 10+ valuation models, including the Peter Lynch Fair Value.
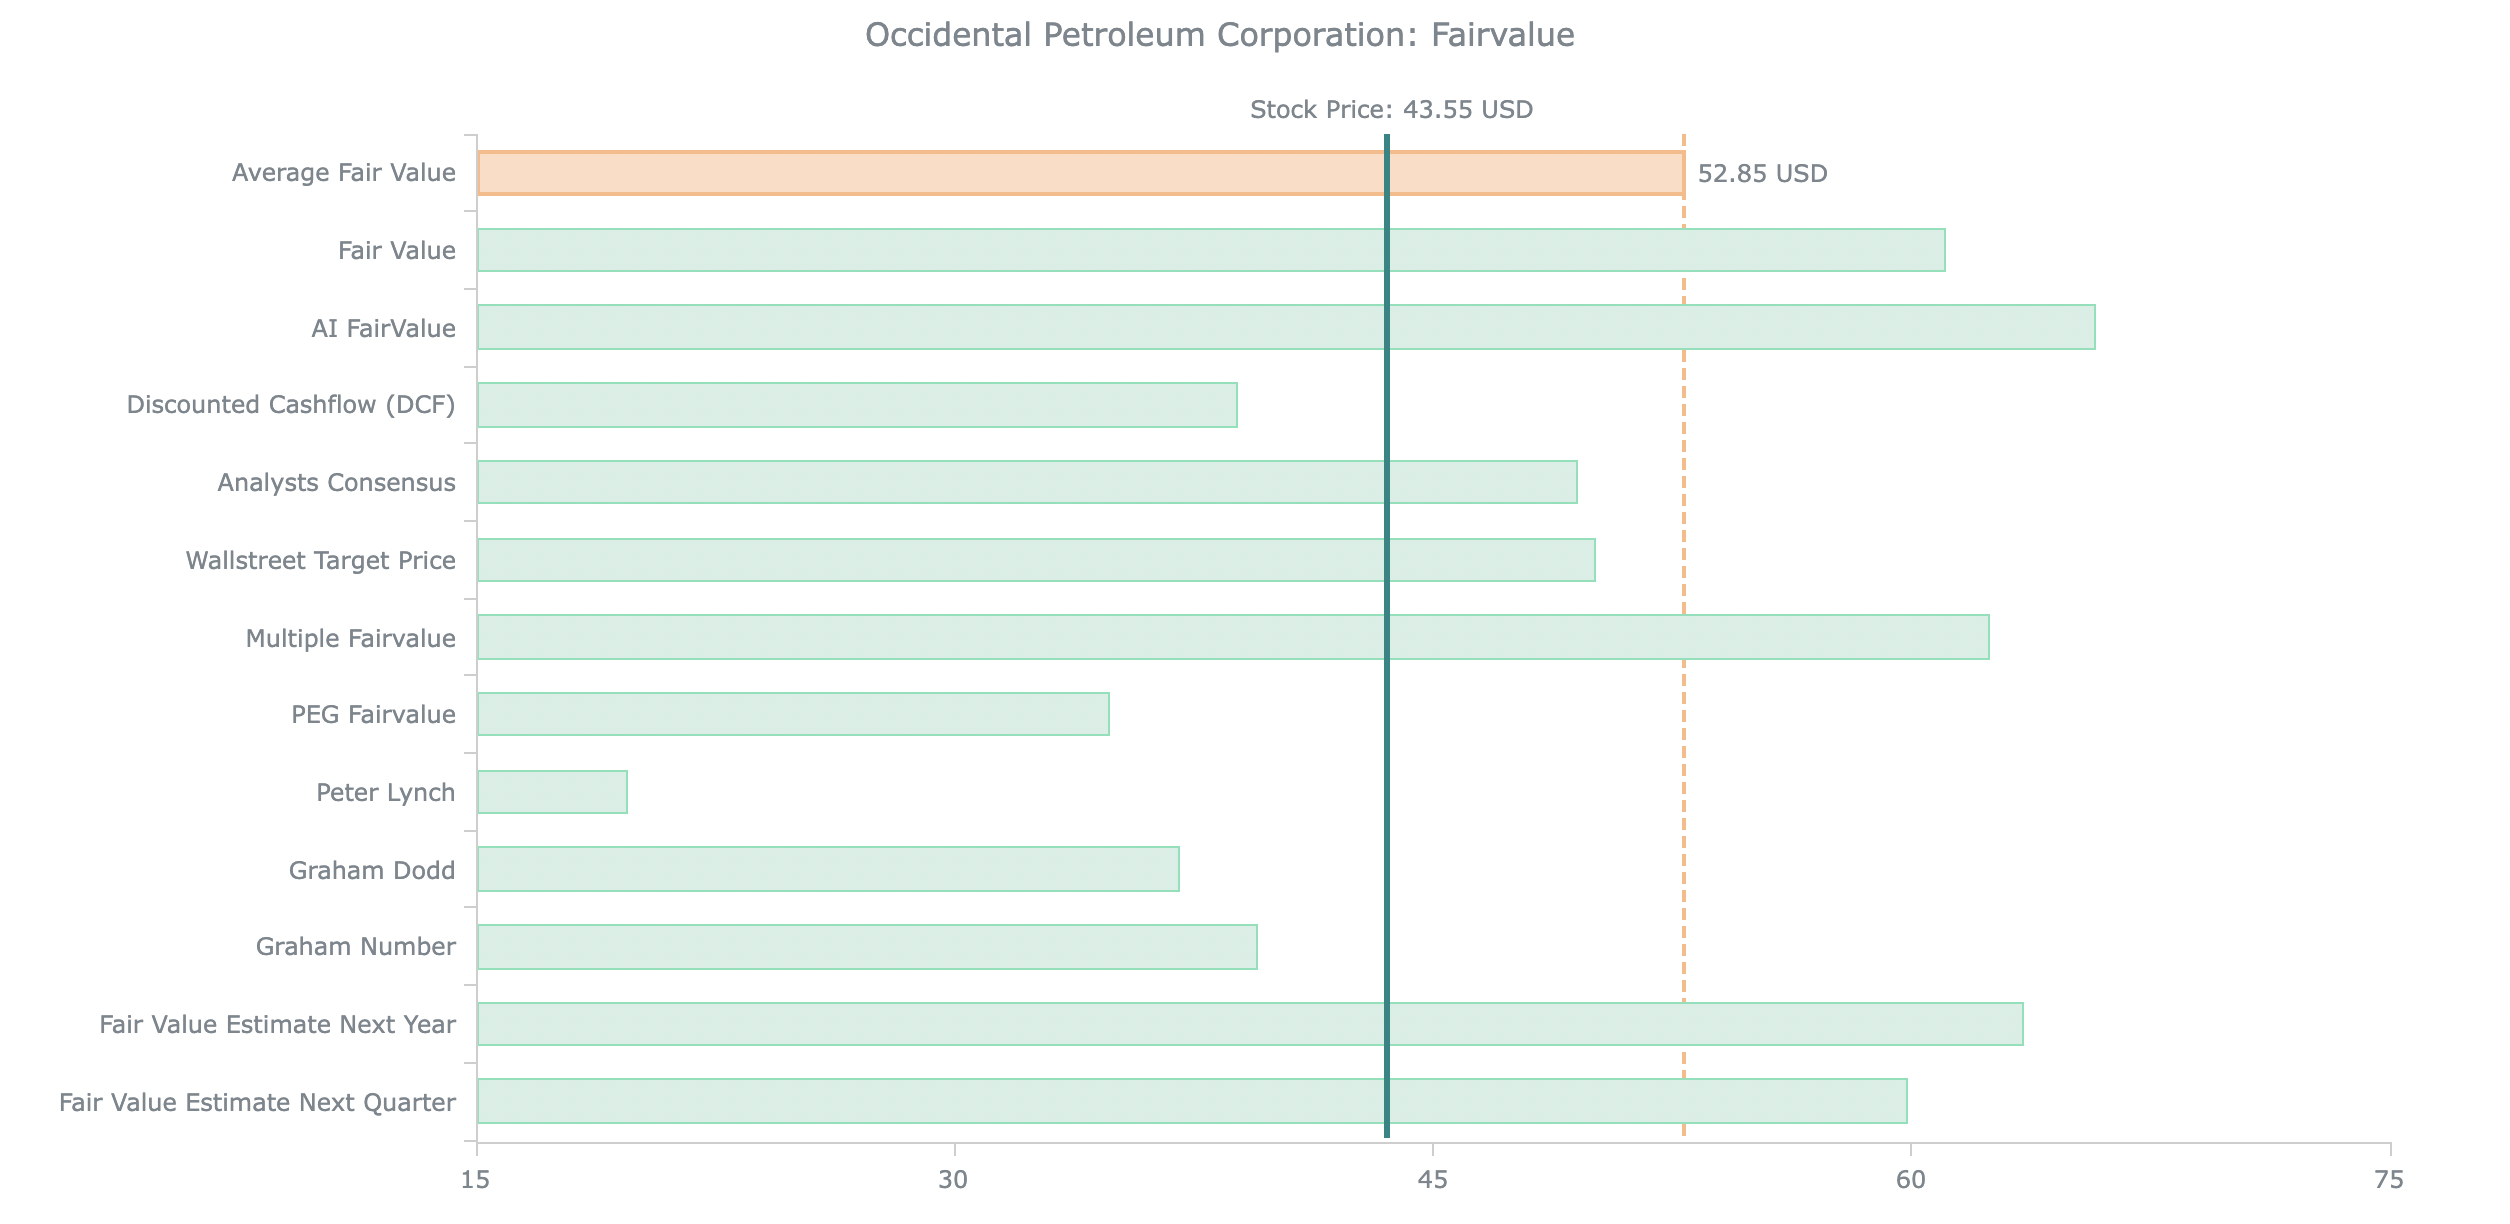
- A powerful algorithm combines AI and over ten valuation models to calculate an average Fair Value – based on DCF, Buffett, Graham, PEG ratio, Peter Lynch, multiples, P/B, P/S and more!
Top 10 Stocks: Peter Lynch Strategy
This list is updated daily by our Stock Screener Tool, covering more than 60,000 stocks worldwide. Discover this and many other Top-Lists inside the Fairvalue Calculator Premium Tool – try it now for free!
How to Use the Peter Lynch Fair Value Calculator
Paste earnings per share (EPS) and sales growth into this Peter Lynch Fair Value Calculator and get the Peter Lynch Fair Value. Earnings per share and sales growth can be found via a Google search, in the annual report on the company’s website under “Investors Relations” or on relevant stock websites:
- Enter the EPS (Earnings Per Share):
Input the company’s current or projected earnings per share. - Enter the Expected Growth Rate (%):
Provide the expected annual growth rate of earnings over the next few years. - Let the Tool Work:
The calculator will apply the Peter Lynch formula, which combines the P/E ratio and the expected growth rate, to estimate the intrinsic value of the stock. - View Your Result:
The result shows you the Peter Lynch Fair Value – a quick estimation of whether the stock is undervalued, fairly valued, or overvalued. - For Deeper Analysis:
Upgrade to the Premium Tool to combine the Peter Lynch method with over 10 other valuation models for a more reliable investment decision.
EPS stands for Earnings Per Share. It shows how much profit a company makes per individual share. It’s calculated as: Net Profit ÷ Number of Outstanding Shares. A higher EPS generally signals a more profitable company. You can easily find the current EPS of any listed company in:
Investor Relations Reports
Yahoo Finance
Your broker’s data feed
Or fully automatically using the Premium Fair Value Calculator.
In the Peter Lynch model, the Expected Growth Rate typically refers to the expected annual revenue or earnings growth of the company. Lynch often used Earnings Growth, but in practice, Revenue Growth can also serve as a conservative approximation:
Analyst forecasts on Yahoo Finance or Marketscreener
Company guidance in investor presentations
Automatically retrieved via the Premium Tool.
In the calculator, enter your best estimate of the company’s future annual growth rate (as a %). View this video to find more information on how to use the calculator:
Peter Lynch Online Fair Value Calculator
Peter Lynch’s online fair value calculator for calculating the fair value of stocks using Peter Lynch’s formula. With earnings per share and the expected growth rate of the company as inputs, this calculator will give you the fair value of the stock under consideration. Compare it with the current market price of the stock and you will be able to decide whether the stock is undervalued or overvalued.
Peter Lynch was one of the most successful mutual fund managers of all time. He had a unique valuation method for stocks with an emphasis on growth stocks and a PEG ratio (always less than 1) which led to an average annual return of almost 30% from 1977 to 1990 in his flagship Magellan Fund at Fidelity.
Lynch is the author of several stock market books and is credited with making investments simple for the masses by rethinking the way stocks are valued. His rule of thumb as mentioned in his books became the basis for this calculator.
Peter Lynch Fair Value Formula:
Original Peter Lynch formula (rule of thumb) to calculate intrinsic fair value of a stock:
Peter Lynch Fair Value = Earnings per Share * Earnings Growth
If a company grows its profits by 10% a year, its fair value is ten times its profit. Peter Lynch was also a proponent of the Price Earnings Growth (PEG) ratio. Companies with PEG < 1 were considered undervalued and those > 1 were considered overvalued. Companies with PEG = 1 were considered fairly valued. (In our calculator we have set a limit of 8-25% for profit growth.) Any growth lower than 8% is automatically considered at 8% and those higher than 25% are capped at 25% respectively for purposes of calculations.
Peter Lynch did not have a specific formula for stock valuation. Instead, he had a philosophy and a set of criteria that he used to assess the potential of a company and its stock. Some of the criteria he considered when evaluating a stock were growth rate, the price-to-earnings ratio (P/E ratio), price-to-earnings-growth ratio (PEG ratio), earnings surprises, financial health, and market trends.
Lynch emphasized the importance of doing thorough research and understanding a company’s financials and business model before making an investment decision. He believed in identifying undervalued growth companies and holding onto them for the long term.
So, while Peter Lynch did not have a specific formula for stock valuation, his approach was based on a combination of qualitative and quantitative factors that helped him determine the potential of a company and its stock.
📈 Peter Lynch Fair Value Formula
Fair Value = Earnings per Share (EPS) × (Growth Rate × 100)
This simplified formula estimates a stock’s fair value by multiplying the current Earnings per Share (EPS) by the expected annual growth rate (expressed as a whole number, e.g., 15 instead of 0.15).
Peter Lynch believed that a stock is fairly valued when its Price-to-Earnings Ratio (P/E) is equal to its growth rate – the core of the PEG ratio.
A PEG ratio below 1 typically indicates a potentially undervalued stock.
Example Calculation – Lynch Formula
| Earnings per Share (EPS): | €3 |
| Growth Rate: | 15% |
| Fair Value (Lynch Formula): | €45 |
According to Peter Lynch, a stock trading below €45 would be considered potentially undervalued in this case.
Peter Lynch Fair Value Valuation Method
Peter Lynch is a renowned American stock investor who was the manager of the Fidelity Magellan Fund from 1977 to 1990. During his tenure, the fund achieved an average annual return of 30%, making it one of the best-performing mutual funds of all time. Lynch’s approach to stock valuation was based on several criteria, which included the following instruments included in his Peter Lynch Fair Value:
- Growth rate: Lynch believed in investing in companies that had a high growth rate and a proven track record of increasing their earnings and revenue.
- Price-to-Earnings ratio (P/E ratio): Lynch believed in “value investing,” and therefore looked for companies whose stock price was relatively low compared to their earnings.
- PEG ratio: The price-to-earnings growth ratio (PEG) takes into account a company’s growth rate, and Lynch looked for companies with a low PEG ratio, indicating that their stock was undervalued.
- Earnings surprises: Lynch believed in investing in companies that consistently exceeded earnings expectations, as this was a good indication of a company’s financial health.
- Financial health: Lynch looked for companies with a strong balance sheet, low debt-to-equity ratio, and a steady cash flow.
- Market trends: Lynch also paid attention to market trends and looked for industries that were growing and had a positive outlook.
Overall, Lynch’s stock valuation method (Peter Lynch Fair Value) focused on identifying undervalued growth companies and holding onto them for the long term. His philosophy emphasized the importance of doing thorough research and understanding a company’s financials and business model before making an investment decision. The Peter Lynch rule of thumb for fair value is only a rough estimate of the intrinsic value (fair value) of a stock.
With the Fair Value Calculator, you can check stocks much more precisely for their fair value. In addition to the more precise online calculators, which use 7 key figures instead of just 2 fundamental key figures, 12 valuation models are combined in our premium tools and their averages are clearly displayed. With the Premium Tools of the Fair Value Calculator, you no longer have to look for the fundamental key figures yourself. All financial data for more than 45,000 stocks worldwide are automatically loaded and processed in the database. In addition, you can use the stock screener to find cheap fair-value stocks even more easily.

💬 Comment by Dr. Peter Klein, Founder of Fairvalue Calculator:
Peter Lynch is a true legend in the world of investing. What fascinates me most is how he managed to consistently outperform the market over a long period of time. With the Fidelity Magellan Fund, he achieved an average annual return of around 29% between 1977 and 1990 — an outstanding achievement that few have matched.
While Warren Buffett is undoubtedly the most widely known value investor, it’s important to remember that Peter Lynch's performance was actually even stronger during his active years. It raises the question: can that still be chalked up to luck? I don’t think so.
Lynch's investment style was unique — simple in theory, but hard to execute. He famously believed in "investing in what you know" and had an incredible talent for identifying growth companies before they became mainstream. His philosophy combined growth with valuation discipline, which makes his approach especially appealing to me.
What I truly respect about Lynch is that he remained grounded despite his success. He taught retail investors to think independently, to stay curious, and to look beyond the headlines. That mindset still shapes the tools I create today.
👉 Learn more about Fairvalue Calculator, our vision, and me.
FAQ: Peter Lynch Fair Value (PEG)
A fast way to gauge if growth is fairly priced: relate P/E to expected EPS growth and cross-check with modern valuation tools.
What is the Peter Lynch PEG idea? ▾
PEG = (P/E) / g, where g is the expected EPS growth rate (use 20 for 20%).
A stock is roughly “fair” when PEG ≈ 1, cheaper below, and richer above—always with context.
How do I estimate a fair price with PEG? ▾
Which EPS should I plug in? ▾
- Use TTM diluted EPS, normalized (exclude one-offs).
- For cyclicals, prefer mid-cycle EPS rather than peak/trough.
- If you use forward EPS, make P/E and g both forward for consistency.
How should I choose the growth rate g? ▾
How do I read PEG values in practice? ▾
- < 0.8: potentially undervalued (check quality & risks).
- ~1.0: roughly fair for the growth assumed.
- > 1.2: potentially expensive unless growth is conservative.
How do I validate PEG with other methods? ▾
How do sector and market conditions affect PEG? ▾
How do dividends fit into a PEG-based view? ▾
Common mistakes when using PEG ▾
- Mixing TTM P/E with forward growth (keep bases aligned).
- Using peak EPS or growth inflated by acquisitions/one-offs.
- Treating g as a decimal (use 20 for 20%).
- Ignoring leverage, profitability quality and cash conversion.
What’s a practical workflow with this page? ▾
- Screen ideas (PEG near/below 1) with the Stock Screener.
- Estimate PEG fair price here.
- Cross-check in DCF and with EV-based multiples (EV Calculator).
- Review on Stock Valuation and size in the Portfolio Manager.
Is this investment advice? ▾
45.000+ Peter Lynch Fair Values
100% Satisfaction - 0% Risk - Cancel Anytime.

